Across the United States in 2025, police officers killed 1,278 people, and Black people were almost three times more likely to be killed by police than white people. According to Mapping Police Violence, there were only six days of the year with no police killings. Read on for information on the states with the most and fewest fatal police shootings, the demographics of the victims, and more.
State With Most Fatal Shootings
CALIFORNIA
128
State With Least Fatal Shootings
RHODE ISLAND
0
Average Shooting
Per State
37.8
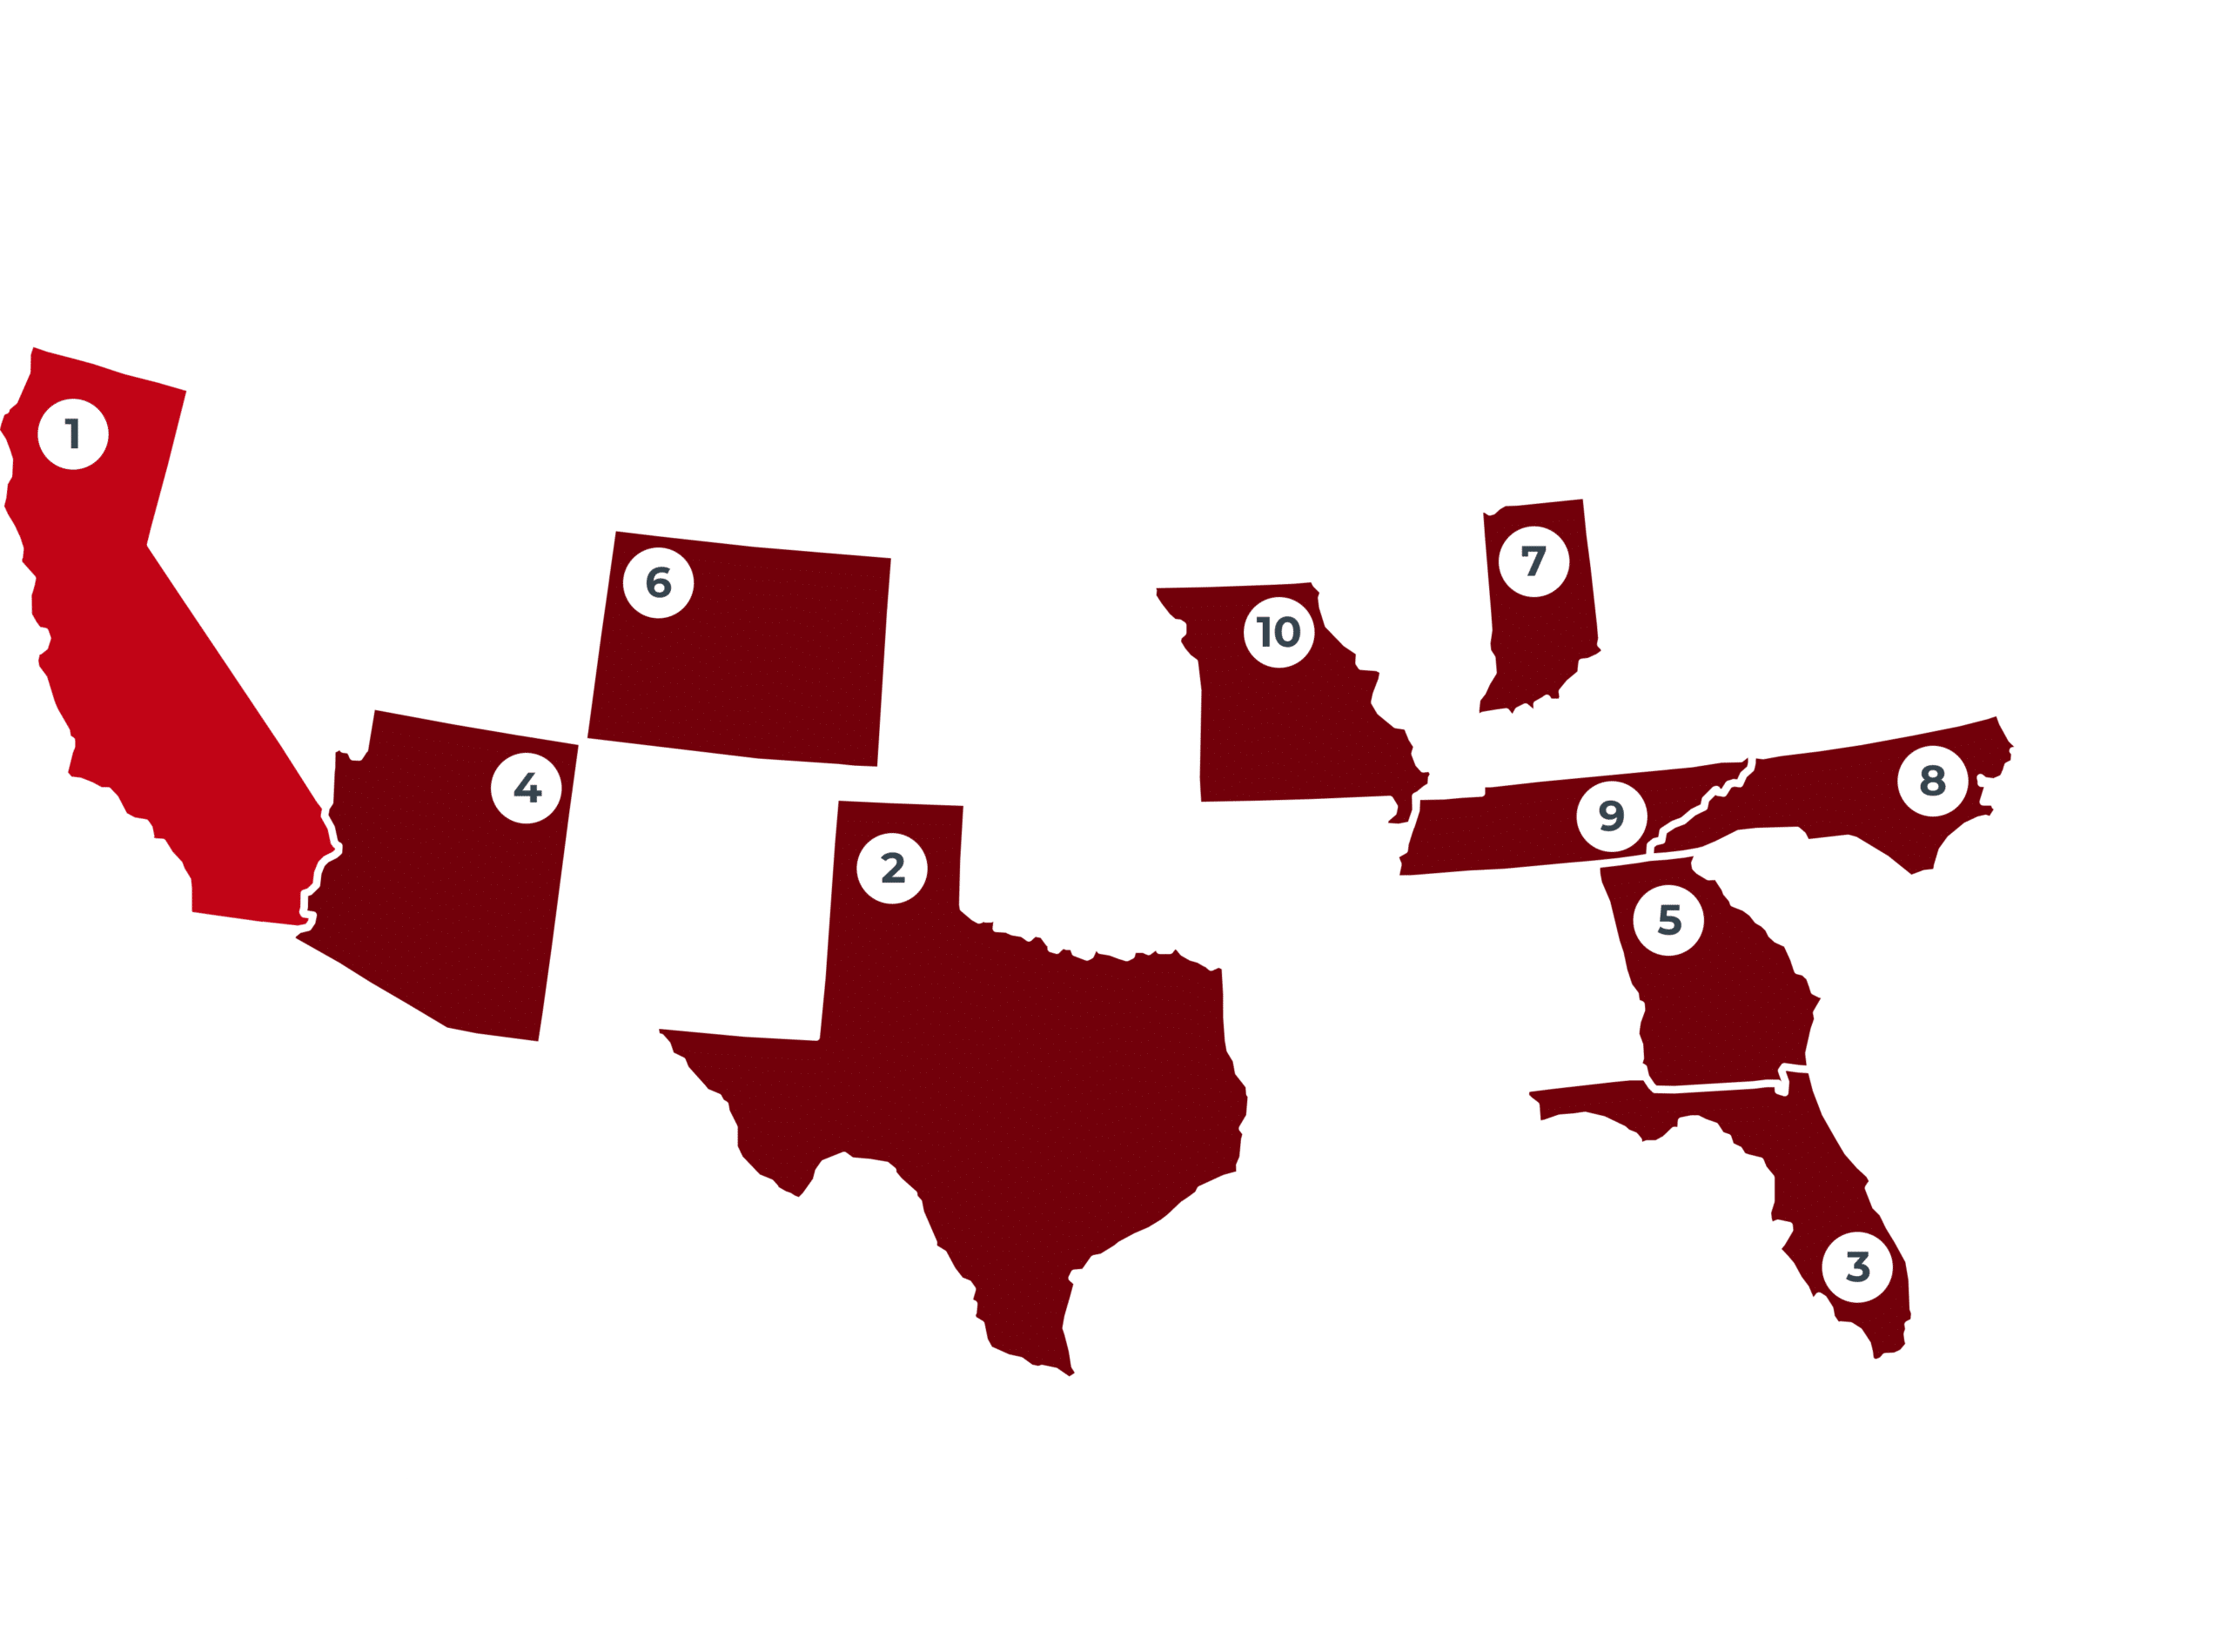
TOP 5 STATES
California
Police in California shot and killed 128 people in 2025. Black people were nearly 3.5 times more likely to be killed by police than white people in California this year.
128
Texas
Texas police shot and killed 107 people in 2025. This number is significantly lower than 2024, which had a record-high number of 168 killings by Texas police.
116
Florida
In 2025, police in Florida shot and killed 101 people, with a large number of the fatalities occurring in major urban areas like Orlando, Miami, and Jacksonville.
101
Arizona
Police in Arizona shot and killed 57 people in 2025, and the top two reasons for police responses that led to fatalities were domestic violence and suicidal individuals.
57
Georgia
Georgia police shot and killed 38 people in 2025, with the most fatalities occurring in Atlanta.
38
BOTTOM 5 STATES
Rhode Island
Rhode Island had no fatal police shootings in 2025 or 2024, making it the only state to have no reported shootings in each year.
0
South Dakota
South Dakota police shot and killed two people in 2025, the same number of police killings as the previous year in the state.
2
Vermont
In 2025, Vermont police shot and killed three people–triple the number of police killings from 2024.
3
Montana
Montana police shot and killed three people in 2025, which is a significant decline from all of the past ten years. In 2024 alone, Montana police killed 13 people.
3
New Hampshire
Police in New Hampshire shot and killed three people in 2025, which is on par with most of the past ten years in the state, excluding 2024.
3
Top 10 States With The Most Fatal Police Shootings
1: Martinsburg: 2 2: Charleston: 2 3: Mount Clare: 1
Wisconsin
12
1: Milwaukee: 5 2: Wautoma: 1 3: Peshtigo: 1
Wyoming
5
1: Riverton: 1 2: Cody: 1 3: Worland: 1
Victims of Police Violence Have Rights
If you or a loved one has been a victim of police brutality or misconduct, Police Brutality Center may be able to connect you with an experienced civil rights lawyer to help you pursue justice. Get legal help today.